Advanced Security Management in Office 365 — Part 2
In the previous part of this series, we did a short overview of the Advanced Security Management...


The old chestnut question “If a tree falls in a forest and no one is around to hear it, does it make a sound?" is surprisingly relevant in the world of cloud collaboration software. Maybe the modern version would be “if a service falls in the cloud and I don’t notice it, is it still an outage?”
I was thinking about this recently because, on October 26 of this year, Microsoft Azure had an outage that affected some of our development environments at ENow. Like virtually every other Azure (or AWS, or Google Cloud) customer, I long ago signed up for Azure Monitor, Microsoft’s suite of services for monitoring Azure-based resources. When the outage started, Azure Monitor made sure that I knew about it—but I found that it has some pretty rough spots, thus this article.
On one hand, talking about Azure monitoring and alerting seems odd given ENow’s strong roots in the Office 365 and on-prem Microsoft world. We don’t currently monitor Azure services… but we do use them. More importantly, Azure as a platform is much broader in scope and reach than Office 365, and Microsoft has spent hundreds of millions of dollars on it-- so looking at what Microsoft has done with Azure monitoring and alerting is interesting to see what we can learn about their approach.
Azure Monitor is intended to provide a single platform for health monitoring across all Azure services; it mashes together audit logging (which Azure calls the “activity log”), performance metrics (gathered and presented in a way very close to how Windows Performance Monitor works), and diagnostic logs (think of these like the event logs on a Windows server—applications can drop their own diagnostic messages into the Azure Monitor logs).
When you get down to it, many Azure resources are direct equivalents of on-premises objects, so it makes sense that we’d see these three distinct categories—they are very close to the familiar equivalents we see in on-prem Windows servers. The interface and tools used to manage Azure Monitor are different from their on-prem counterparts, but the basic idea is the same.
One important difference, of course, is that Azure Monitor monitors things that don’t exist in Windows. For example, consider the Azure scale set. A scale set is really just a bunch of VMs that Azure will start or stop according to the scale settings you apply (for example, you can say “add another VM when average CPU utilization for the existing fleet exceeds X%”), so it makes sense that you can see the scale set members in the existing Azure Monitor areas. Azure Monitor includes specific tools for monitoring Autoscale even though that mechanism doesn’t exist in on-prem Windows. The same is true for other types of unique Azure services.
The key point to remember: Azure Monitor gathers data so you can inspect it. If you’re not around to hear the tree falling, it won’t do you much good.
Monitoring by itself is, as my old calculus professor would say, “necessary but not sufficient.” The table below shows a few key differences between monitoring and alerting. The simplest way to summarize the differences is to say that alerting is what happens as a result of monitoring—when something you’re monitoring exceeds the limits you’ve set, then alerting happens.
| Monitoring | Alerting |
| Continuous: always watching | Discrete: only triggered when something happens |
| Shows current view | Only shows what already happened |
| May be able to project trends | Nope |
| Example: Rainfall gauge | Example: Tornado siren |
Azure allows you to get alerts based on a few different occurrences. First, you can get alerts when something interesting happens, as reflected in the activity log. In this case, “interesting” can be defined as a variety of create, update, delete, or resource usage events. Second, you can get alerts when there is a service health notification—in other words, when an Azure service breaks, you can get notified. (Stop for a second and ask yourself why you can’t get these notifications from the Office 365 service health dashboard…)
The fun really starts once something happens and you start getting notifications.
I mentioned earlier that Azure storage had an outage on October 26th that affected a variety of storage based services. I first found out about it when I got this email at 1:03pm my time (6:03pm UTC):
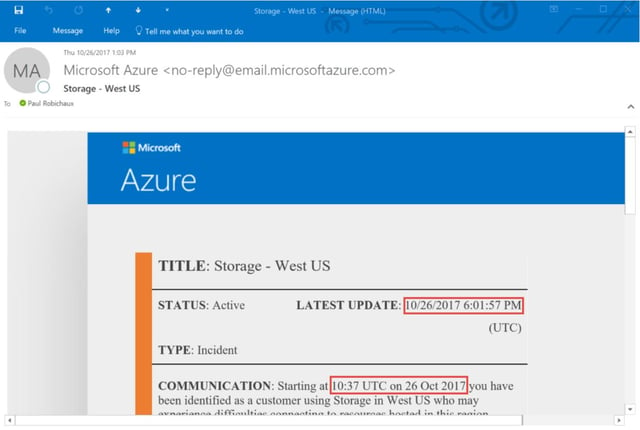
I’ve highlighted the interesting parts in red. Within 2 minutes of sending the alert, it was in my inbox—that’s good. But Microsoft identified the issue starting nearly eight hours before they told me about it. If this outage had affected critical systems, I’d be pretty angry about that. This reflects something I tell customers all the time about Office 365: there is absolutely a lag time between the appearance of a problem in Office 365 and official recognition by Microsoft that the problem exists and then another lag time before customers are notified.
About the same time, I got a couple of alert text messages:
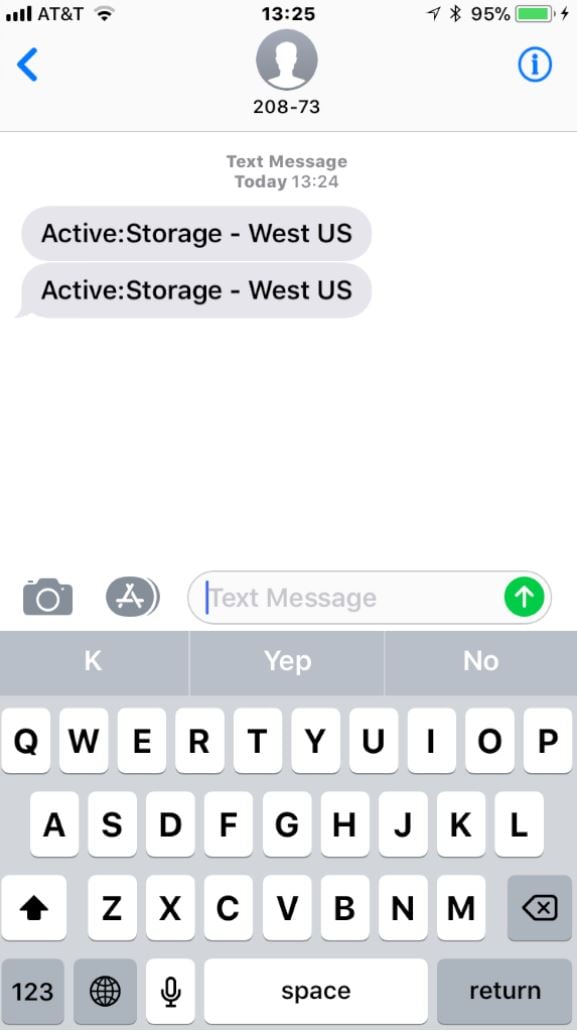
There’s a lot going on here… wait, no; there isn’t. “Active: Storage – West US” is a terrible alert message. It doesn’t tell you what’s wrong. If you don’t recognize the SMS shortcode that sent the messages, you may not realize that “Active” means that there’s an active incident… meaning that something is broken. The message doesn’t say what’s broken, who’s impacted, or where to get more information. It doesn’t tell you how to stop getting alerts, or really anything else. I give this a grade of D; as an alert notification it is only barely better than no notification at all.
A little later, I got a couple more messages, including this gem:
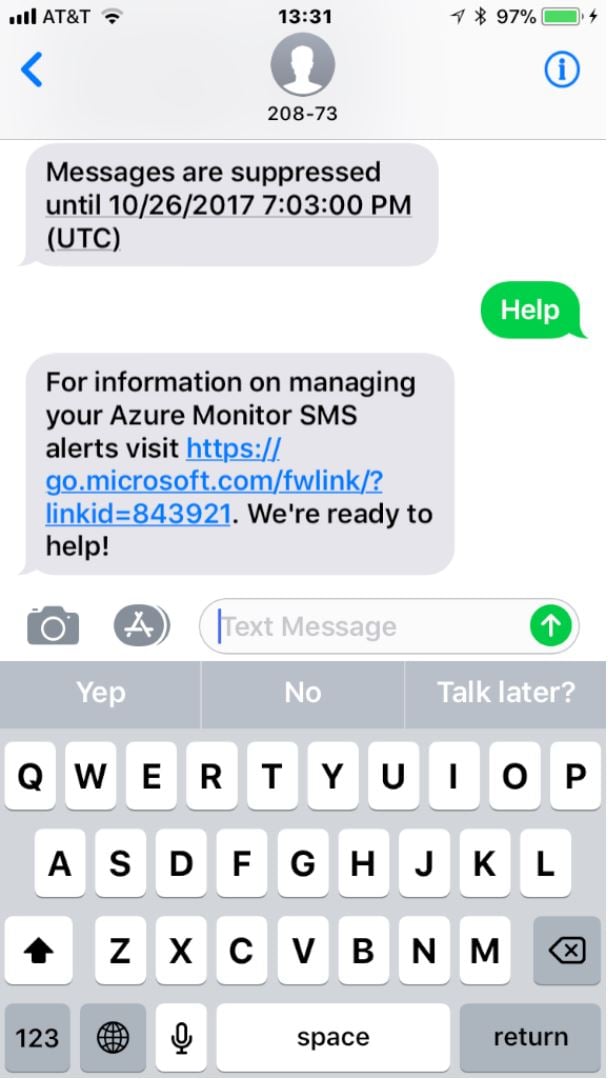
So many questions! Why are alerts being suppressed? I didn’t ask for that. If alerts are suppressed, then why am I still getting email messages (because I was)? When I go to that link, why doesn’t it tell me why my messages were suppressed, how to un-suppress them, or anything about what generated the alerts?
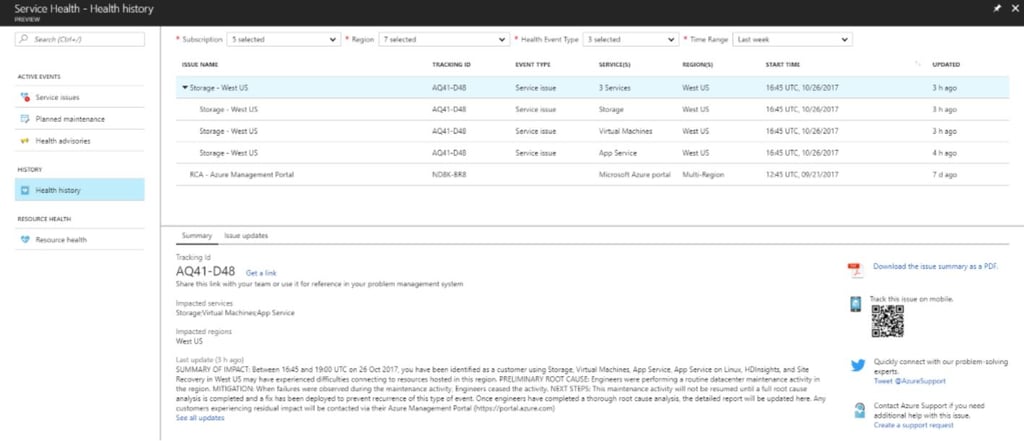
On a positive note, Azure was telling the truth; I didn’t get any more text notifications. I did get several more email notifications, including one that told me that the problem had been resolved. It identified the issue as starting at 1645 UTC, or roughly 7 hours later than the original mail’s claim. I don’t know which is right—so I’ll chalk the difference up to either a time zone bug or to misreporting of the actual incident times.
When I visited the Azure service health portal, it showed a clear summary of the incident history, along with easily accessible links to the AzureSupport Twitter account and some other useful troubleshooting resources. So I give them an A- for the portal, but can’t award better than a C+ overall for the actual notifications themselves.
After this whole episode, I felt really good about the capabilities that ENow’s products give our customers for proactive monitoring of Office 365 and on-premises workloads. Why? Because, despite the fact that Microsoft has a huge war chest of cash and a deep bench of smart, talented engineers, we still offer better monitoring and alerting for Office 365:
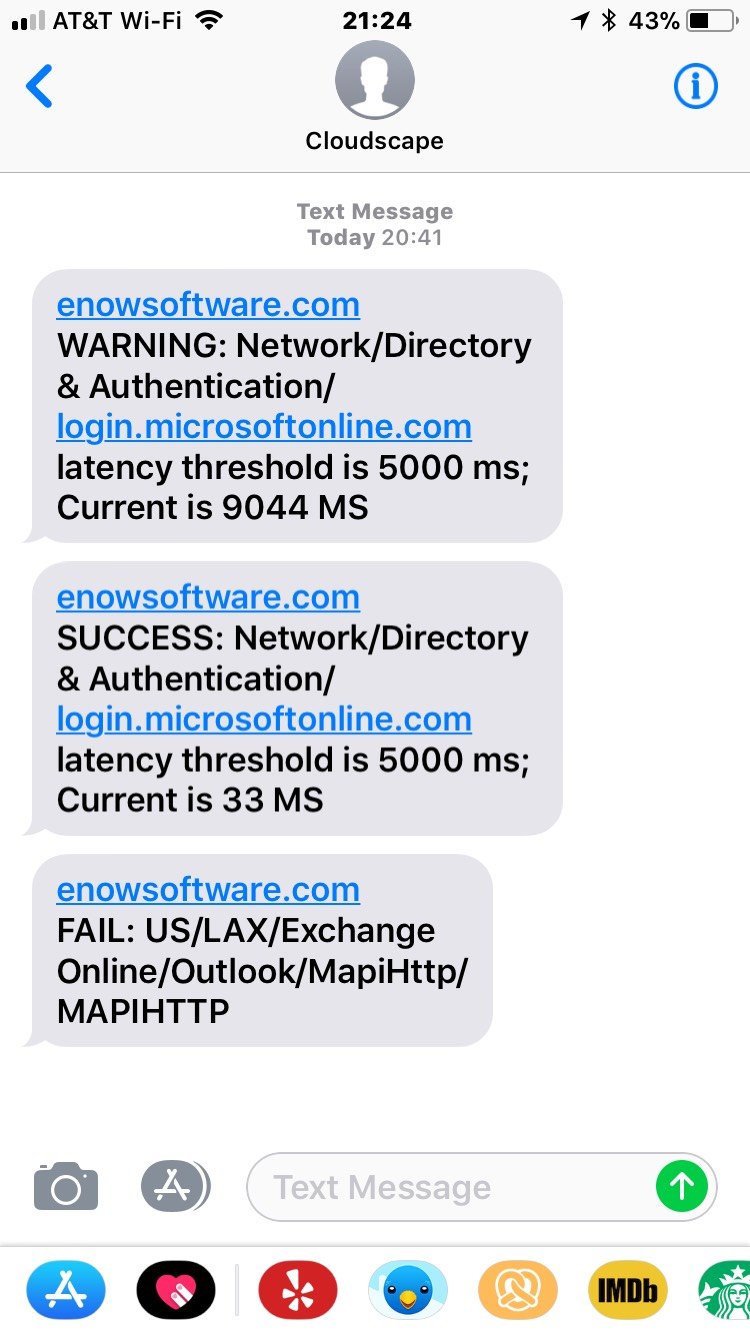
If you want reliable notification of Office 365 outages and problems as they happen, we’ve got an app for that. Use the button below to get started.


In the previous part of this series, we did a short overview of the Advanced Security Management...


Welcome to part 3 of "Addressing the Office 365 Monitoring Gaps". In part 1, we discussed the...