Mailscape 365 - A Comprehensive Review
Editor's Note: Originally posted by Paul Cunningham (Microsoft MVP) on his blog, Practical365, this...


…that Mailscape 365 includes latency trending reports which allow you to monitor and report on connection latency and end user transaction times?
There used to be a time when monitoring applications was limited to monitoring the health of the server that hosted the application. Even today, this approach is commonly used by various monitoring applications. The problem with this approach is that it does not truthfully reflect the state of the application from an end user perspective. Secondly, it’s useless in scenarios where you do not have access to the servers; cloud-based applications like Office 365 being a great example.
With the traditional approach, most administrators believe that a server that is running low on resources could cause the application hosted on that server to run slowly. However, it might be running just fine too. The flaw of this approach is reflected perfectly when, for example, you are monitoring memory usage on an Exchange or SQL server. High memory usage does not reflect poor performance for either SQL or Exchange; because of how these applications are designed, they are likely to consume most of the memory made available to them.
The question is: what do you do to determine if an application is performing slowly? You measure the time it takes to connect to the application or how long it takes to complete a specific action. This measurement is often referred to as latency. In order to capture the latency, you must actively test the application by measuring the connection times or executing so-called synthetic transactions. Synthetic transactions programmatically execute the same actions a typical end user would do. An example of such a transaction would be to login in to Outlook Web App or query Free/Busy information for another user. The other ‘gotcha’ is that you want to execute these transactions from wherever your users are. Simply executing these transactions from within your datacenter is pointless: this is probably the only place where your users will never be working from.
Mailscape and Mailscape 365 execute several synthetic transactions both from within the datacenter as from remote locations using remote probes. Our transactions cover scenarios such as mail flow, client connectivity protocols such as ActiveSync, Outlook Anywhere and MAPI/HTTP and specific functionality such as Autodiscover, Free/Busy, etc…
For each of these transactions we measure the success of the transaction and we capture and store the total transaction time, a.k.a. latency. This latency can then be reported on using the interactive transaction latency report wizard:

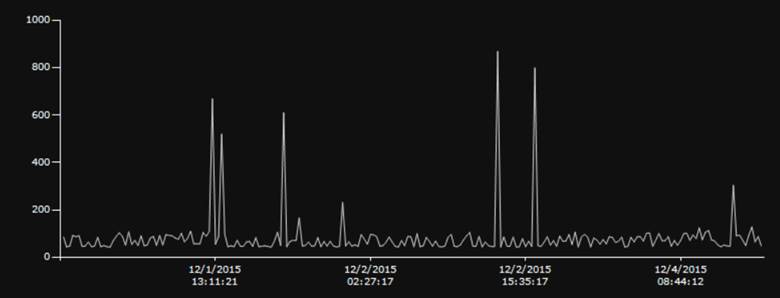
The wizard allows you to select for which probe (local or remote) and which test you want to view data. There are two types of reports: detailed and average reports. The detailed reports are particularly useful when you are troubleshooting a problem or when you are investigating reports of “slow behavior”. The following screenshot depicts a latency report which represents the latency data over a period of several days:

Because of the clear distinction between each measurement, it is very easy to detect anomalies such as the peaks in the above image. These peaks represent times when transactions took (much) longer to complete and thus reflect poor end user experience.
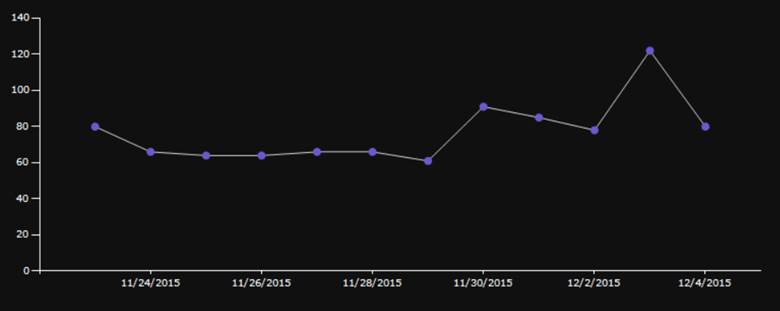
Alternatively, you can use the Averages to analyze the same raw data over a longer period of time. Because the averages roll up into a daily measurement (instead of many daily measurements), this report is particularly useful to determine how the performance or connectivity of your system has evolved over time:

Ideally, you would want both reports to show a flat line which is as close to zero as possible. In reality, however, this will never happen. The above chart clearly illustrates that over a period of a few weeks, the latency has increased. There are a few reasons why this might have happened. It is possible that you are close to saturating your available network bandwidth or perhaps there is a hardware problem which causes the application suffer from performance problems. Often the increased latency is because of additional load on the systems. This would for instance be the case when you have been adding more users to your platform.
The ability to retroactively go back and take a look at your application’s or cloud-based solution’s performance enable you to identify potential bottlenecks, but it also helps you to plan for future hardware upgrades as you can track, monitor and trend the behavior over a longer period of time.
Pro tip: the latency reports are also an excellent way to determine the network latency to Office 365 prior to deploying or migrating Office 365 and can help you determine problematic locations with little efforts!
Cheers,
Michael

Michael Van Horenbeeck is a Microsoft Certified Solutions Master (MCSM) and Exchange Server MVP from Belgium, with a strong focus on Microsoft Exchange, Office 365, Active Directory, and a bit of Lync. Michael has been active in the industry for about 12 years and developed a love for Exchange back in 2000. He is a frequent blogger and a member of the Belgian Unified Communications User Group Pro-Exchange. Besides writing about technology, Michael is a regular contributor to The UC Architects podcast and speaker at various conferences around the world.


Editor's Note: Originally posted by Paul Cunningham (Microsoft MVP) on his blog, Practical365, this...

