Overcoming corruption during mailbox moves
The following blog post is a trimmed-down excerpt from the eBook "Exchange Server Troubleshooting...


Often times I’ll find myself writing a blog post because the topic recently became relevant due to customer need. Other times I spend hours banging my head against the keyboard trying to resolve an issue and would like to keep others from going through the same ordeal.
In this particular case, I found myself thinking of this fall’s release of Apple iOS 8 & some of the traditional unexpected consequences that arose when used to connect to Exchange via ActiveSync.
In past cases, an update could lead to excessive CPU usage & transaction log growth; of course it’s not just Apple with a long rap sheet of poor implementations of ActiveSync. With it being the holiday season, we can expect a wave of new gifted devices being brought into work by users and administrators everywhere will face the challenge of ensuring they don’t have an adverse impact to the stability of Exchange.
Of course it’s not accurate to say that ActiveSync is the cause of all individual mailbox performance issues. In my experience, the following can cause mailboxes to put more strain on the server than expected:
Sometimes Administrators or Support Engineers might find it useful to be able to have an inside look into Store to see which mailboxes are generating the most transaction log files as well as spending the most time in CPU. Get-StoreUsageStatistics is a useful command for when you find your server under an unusual amount of load, or any other situation where you’d like to know which mailboxes were generating the highest workload against the databases. There have been a few other posts that discuss how to troubleshoot these scenarios, but not much has been said of Get-StoreUsageStatistics.
With Exchange 2010 (and later 2013) came the introduction of Get-StoreUsageStatistics. This command gave you the ability to query the Information Store itself & get statistical information regarding how the mailboxes inside a database were using resources. There wasn’t much of a big deal made about the command when 2010 released (probably over-shadowed by all the other improvements in the product since Exchange 2007) except for a few passing mentions of the command in various Microsoft blog posts. However, the Technet article has some useful information on the Get-StoreUsageStatistics cmdlet.
Use the Get-StoreUsageStatistics cmdlet to aid in diagnosing performance issues with your servers or databases. The Microsoft Exchange Information Store collects per-user information on latency, input/output (I/O), page counts, processor usage, and TimeInServer. TheTimeInServer metric represents the total time that synchronous and asynchronous requests spend in the Microsoft Exchange Information Store for a user's mailbox. You can retrieve this resource information in the Microsoft Exchange Information Store for the 25 highest usage accounts on a specified database. Usage of a mailbox is defined as the amount of server time spent in performing operations for that mailbox. The cmdlet reports the top 25 users for every one-minute period for the last 10 minutes (250 objects per ten-minute interval). The resource usage is an indicator of the load that different users are placing on the server
The command also exists in Exchange 2013 but the 2013 version of the article has much less detail; though its usage remains roughly the same.
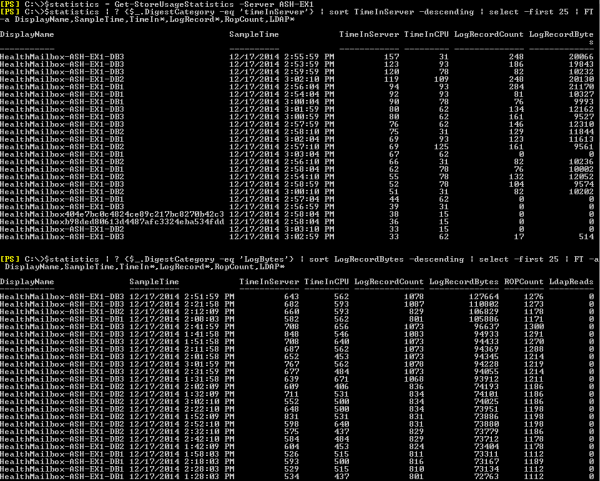
There are a couple very basic examples online for how to use the command but personally I’ve gotten the most use out of the syntax (below) given to me by a Support Engineer at Microsoft (if you attended my Troubleshooting Exchange session at 2014 Dev Connections then you may have already seen this command in the slide notes). It will give you the TimeInCPU, TimeInServer, LogRecordCount, & LogRecordBytes for the top 25 mailboxes; and in an easily readable format.
$statistics = Get-StoreUsageStatistics -Database <YourDatabaseName>
$statistics | ? {$_.DigestCategory -eq 'timeInServer'} | Sort TimeInServer -Descending | Select -First 25 | FT -a DisplayName,SampleTime,TimeIn*,LogRecord*,RopCount,LDAP*
$statistics | ? {$_.DigestCategory -eq 'LogBytes'} | Sort LogRecordBytes -Descending | Select -First 25 | FT -a DisplayName,SampleTime,TimeIn*,LogRecord*,RopCount,LDAP*
![]()
My environment is a lab so it’s not unexpected that my heaviest users are the health mailboxes. Below you’ll find similar output but for all databases on a particular Exchange Mailbox Server. You can compare the output of these commands to the default examples listed in Technet and will likely find they’re much more intuitive and easy to parse through.

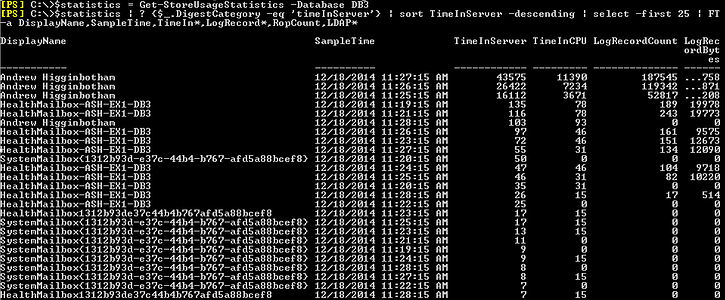
To give a simplistic and practical example, I used a very basic script to generate email and push one particular mailbox above the expected usage pattern. The command below will generate 300 emails From/To the “Andrew” account in my test environment; including a 5MB attachment.
1..300 | ForEach {Send-MailMessage -To andrew@ash.net -From andrew@ash.net -SmtpServer ash-ex1 -Subject "MassEmail" -Body "body of message example" -Attachments "C:\Attachment\attachment.zip"}
With the example below, you can now see that the “Andrew” account has jumped to the top:

I usually don’t spend any time deep diving into the numbers of each sample interval rather, I look more for an overall pattern. If you had a few mailboxes consistently showing up at the top of these counters then it’s a solid indicator those are your power users.
If you run these commands daily you may always find the same users showing up at the top of these counters; which may just be representative of their expected load. Large mailboxes, large number of messages sent/received daily, etc. This is why it’s so important to have a baseline, so you can differentiate between a normal workload during peak times and an unprecedented spike potentially caused by one of the aforementioned factors.
So you may find it useful to periodically run (or a scheduled task) these commands and output them to CSV. The below commands can get you started:
$statistics = Get-StoreUsageStatistics -Database <YourDatabaseName>
$statistics | ? {$_.DigestCategory -eq 'timeInServer'} | Sort TimeInServer -Descending | Select -First 25 | Export-Csv C:\OutputFile1.csv -NoTypeInformation
$statistics | ? {$_.DigestCategory -eq 'LogBytes'} | Sort LogRecordBytes -Descending | Select -First 25 | Export-Csv C:\OutputFile2.csv -NoTypeInformation

I work for Dell as a Principal Engineer in the Global Support & Deployment organization; serving as a senior point of escalation for Microsoft technologies to Dell's ProSupport & Consulting Services customers. My specialties are Exchange, Office 365, & Directory Services; while also being responsible for internal training development/delivery & managing various projects. I'm a Microsoft Certified Master in Exchange 2010 & a Microsoft Certified Solutions Master in Exchange 2013. I enjoy getting to work with a wide variety of customers, as it allows me to assist in resolving the various complexities & challenges they encounter. I try to use that experience to help others by blogging at Exchangemaster.wordpress.com with a few of my fellow MCM's at Dell. I also co-founded an Exchange Server community on Reddit (Reddit.com/r/ExchangeServer) where I answer questions on the product & help lead discussion around Exchange/Office 365. You'll also find me blogging about various other topics at ashdrewness.wordpress.com. I'm also the co-author of the Exchange Server Troubleshooting Companion (http://exchangeserverpro.com/ebooks/exchange-server-troubleshooting-companion/) I enjoy spending time with my lovely wife Lindsay, am a Texas Longhorns/Houston Texans fan, & try to sneak out onto a golf course every chance I get.


The following blog post is a trimmed-down excerpt from the eBook "Exchange Server Troubleshooting...


In my previous article in this series, we discussed Exchange “Alternative Architecture” options for...