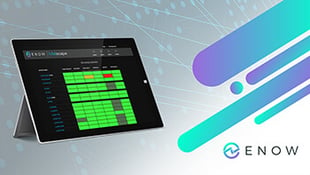
Exchange Monitoring: Built in Tools for CAS Monitoring in Exchange
Built-in tools for CAS Monitoring in Exchange 2016/2019
With some small and medium size businesses...


When it comes to monitoring application administrators often disagree with system administrators on what to monitor and which thresholds to configure. By nature, system administrators focus on system related counters and objects to monitor. They do not care about application related monitoring as those information's are out of scope of their daily work. Vice versa the same is true for application administrators.
Therefore there is no and will never be a single monitoring solution to combine totally different interests in information. On the other hand, the business is highly interested in implementing a single monitoring solution to reduce the overall licensing cost (priority 1), reduce the number of servers required to host monitoring solutions (priority 2) and to eliminate the need for technical training (priority 3).
System monitoring and application monitoring systems sometimes share an intersecting set of “things” they are able to monitor. The fact is that both monitoring approaches have totally different procedures on how to monitor.
The following diagram illustrates the system monitoring approach, where a probe connects to a target and queries data using a dedicated protocol supported by the target (e.g. SNMP, WMI, SSH, etc.).
The solution illustrated uses PRTG which is a network monitoring solution that supports all standard protocols for monitoring. It can be enhanced by individual scripts, programs and libraries.
In comparison to system monitoring the application monitoring approach looks very different, as the following figure shows:
Application monitoring relies on the existence of agents installed locally on the servers hosting the applications. This approach provides the ability to monitor from an application perspective. The agent itself performs checks depended on the application running on the same server. For example the agent checks that DNS name resolution works using the configured DNS servers on the server. If DNS resolution does not work the agent responds with an error to central management even when the DNS server itself is reachable by the system monitoring probe.
In the current IT landscape where messaging and collaboration solutions provide business functionality at a large scale and are setup in high-availability configurations the monitoring of such implementations from an application perspective is crucial. In a world where “always on” is the business goal for a mobile work force downtime of messaging and collaboration systems is an issue.
The ENow Management System helps to monitor the following:
Mailscape is the part of the ENow Management System which helps you to monitor the messaging infrastructure components like Exchange Server, Blackberry Enterprise Server and SMTP relay servers.
Compass is the part of the ENow Management System which monitors domain controllers and Active Directory specific topics.
ForeSite is the part of the ENow Management System which monitors your SharePoint farms and the related SQL database servers.
Besides monitoring the vitals of the application components and the infrastructure requirements (network, AD, etc.) the solution provides an extensive reporting functionality. The default set of reports fits most reporting requirements, but you can set up your own reports as well. A significant feature is the ability to provide the reports to different groups of stakeholders.
Monitoring servers should not be a time consuming task for an application administrator. Therefore the interface of the ENow Management System is quite handsome, as it displays all statuses in a dashboard. As long as all statuses are green the application administrator can focus on other work. When using all parts of the ENow Management System you act within one single dashboard, but each part utilizes it’s own security groups for access the dashboard.
How does a SharePoint administrator work with ForeSite?
The follow screenshot shows the ForeSite dashboard:
If the dashboard uses a traffic light approach to signal good, warning and error states. This makes it really easy to focus on section of the application infrastructure where some is not in a healthy state. It cannot be any more intuitive.
By just clicking on the signaling rectangle you dig deeper to the next level of information:
It seems as if there is something wrong with a SharePoint timer job. But what?
Ok, it is not the SharePoint timer service itself. It is just one of the timer jobs itself.
The Application Addressed Refresh Job is offline since 3.4 days. That is a valuable information and the SharePoint administrator knows where to start to solve this issue.
This is a basic example how an application monitoring solution can help to identify the error.
The reporting functionality of ForeSite helps to gather a lot of different data from a SharePoint farm. Those reports can be executed manually or be sent automatically by email on a recurring basis. The reports overview displays a list of different reports which are available by default:
With the proactive monitoring of critical SharePoint services, like Site Availability, Timer Jobs, Search and Index, and content databasesForeSite helps the application administrator to focus on daily work. The alerting functionality helps to reduce the response time in the case of an error and therefore helps to reduce the overall business impact to a minimum.
The classic system monitoring solution is the interface of the administrative personnel responsible for the IT infrastructure itself. The application monitoring solution is the main interface for application administrators and runs on top of the IT infrastructure. Even when some components (disk, memory, CPU, …) are measured by both components.
Besides monitoring of different important aspects of the application an application monitoring solution provides the ability for application specific reports. Those reports and even the dashboard itself can be made available to different groups of stakeholders in the company using Windows credentials.
An application monitoring and reporting solution is a valuable addition to classic system monitoring.
What are your thoughts on system and application monitoring?


With some small and medium size businesses...


Editor's Note: Originally posted by Paul Cunningham (Microsoft MVP) on his blog, Practical365, this...